Debugging
“JTL-Debug” plug-in
JTL Debug is a plug-in integrated into the JTL-Shop that serves to provide information regarding templates and the online
shop, for optimal template and plug-in development.
With this plug-in, you can display a variety of template information during the online store’s runtime.
- Smarty variables
- active hooks
- PHP errors
- Session
- POST objects
- GET objects
- COOKIE objects
- Script memory use
- phpinfo()
- Cache information
- NiceDB profiler
This is very useful when developing your own template or plug-in.
Installation
JTL Debug comes with the JTL-Shop and can be installed in the back end via the plug-in manager.
Afterwards, you can configure the JTL Debug settings and adjust the scope of information to be displayed, according to
your individual needs, all by using the plug-in manager.
Settings
JTL Debug will be called up in the front end of your shop by default with the [STRG]+[Enter] combination.
JTL Debug can also be called up using a GET parameter in lieu of the keyboard shortcut. Then, set
the “Activate only with GET parameter” setting to “Yes”.
The name of the GET parameter is by default jtl-debug.
Under “output”, you can specify what type of information you want JTL Debug to display.
Front end
If you press [CTRL]+[Enter] while in the front end of your shop, the debug output will open.
You can then use use the built-in search function to search for variables and values.
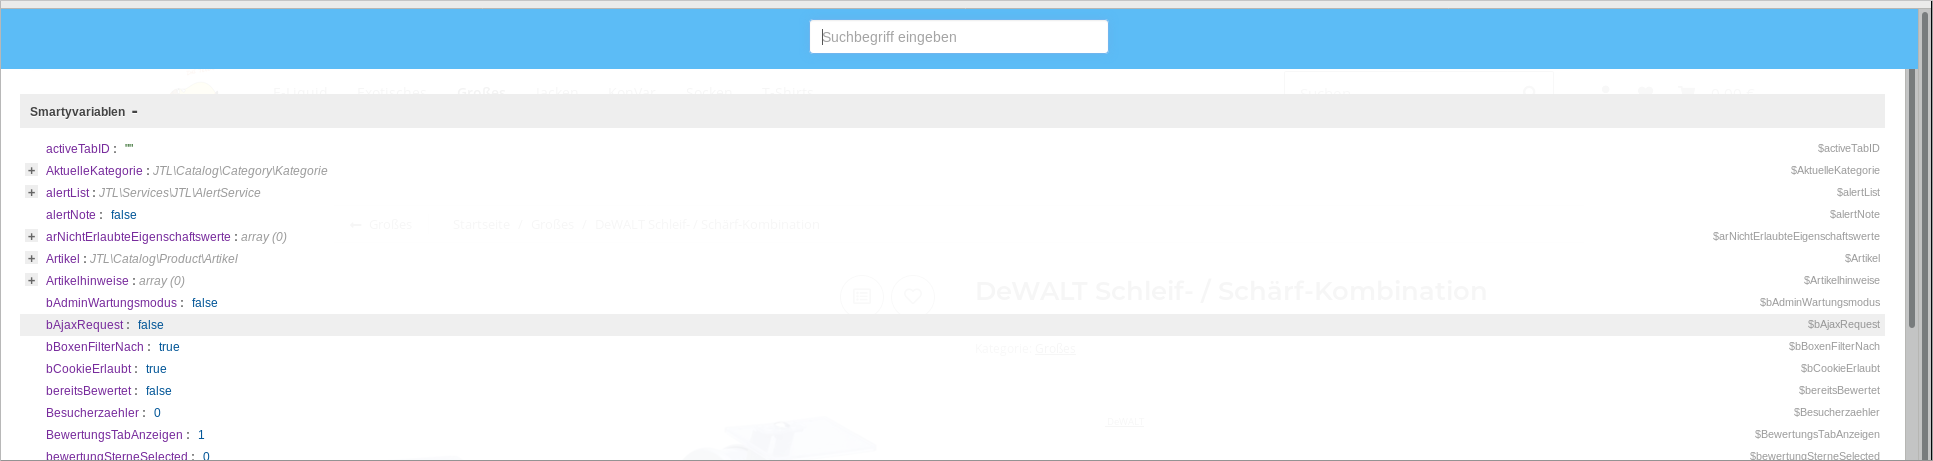
Front end debug-bar
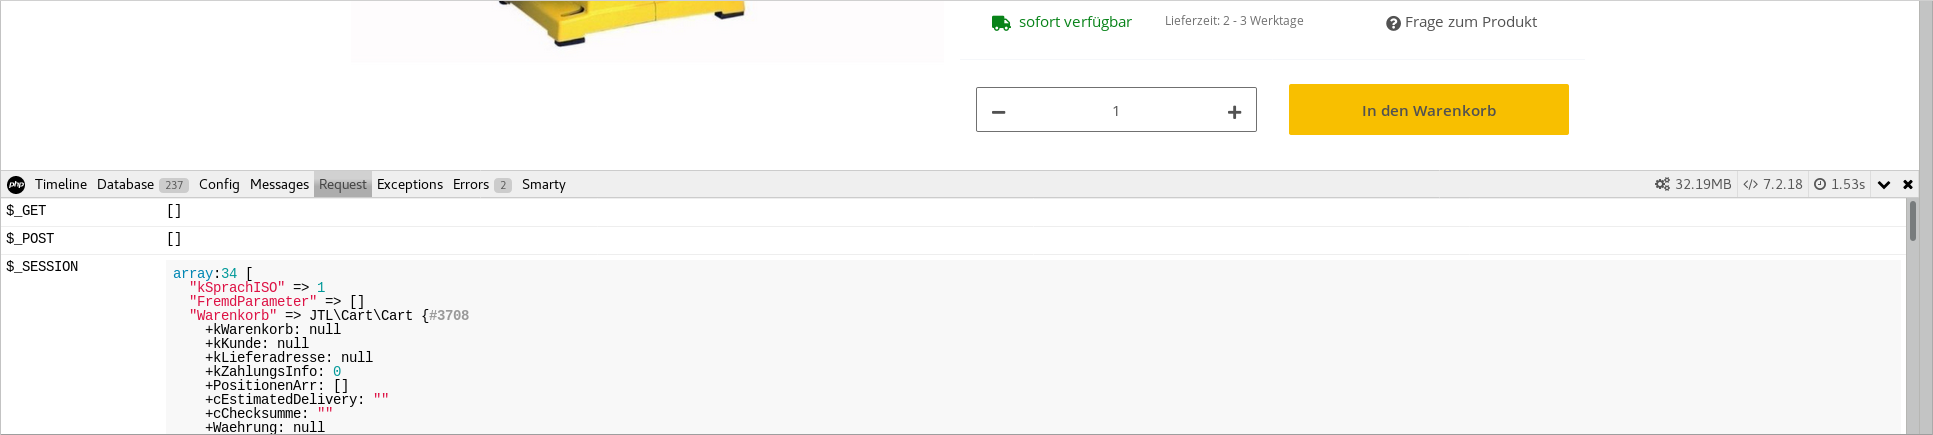
JTL-Shop also provides the PHP Debug Bar,
as an additional debugging option. This can be activated via the SHOW_DEBUG_BAR constant.
In the Shop-Config (includes/config.JTL-Shop.ini.php), set this constant to true in order to display debugging
information in the bottom of the screen as well: